New SHP Visit Utilization by DX and HHRG Report Helps Agencies Control Costs
As Medicare reimbursement continues to decline, home health agencies continue search for ways to keep their agencies profitable without compromising quality. Direct care visit costs represent between 60 – 70 percent of agency costs, so having the ability to compare average number of visits by discipline is an important part in understanding if an agency is under-utilizing or over-utilizing certain disciplines. 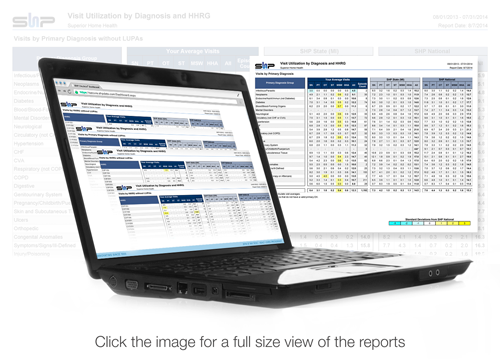
The new SHP Visit Utilization by Diagnosis and HHRG report provides home health agencies with their real-time visits per episode utilization.This report provides average visits by discipline by Primary Diagnosis Category and HHRG group. Diagnosis sections include average totals for all disciplines (SN, PT, OT, ST, MSW, HHA). HHRG section includes average totals for non-therapy disciplines (SN, MSW, HHA). State and National benchmarks are provided allowing comparison of your scores to all providers. These new reports will help agencies to quickly identify which HHRG or DX category they need to analyze further by the highlighted color coded deviations similar to the way SHP reports their other benchmarks. These reports can also be filtered by multi-site users to help identify best practices among an agency’s enterprise locations. As an additional benefit, the report can be further filtered to show visit utilization by telemonitored vs. non-telemonitored patients.
SHP recommends agencies identify the highest variances with the most volume of episodes to begin their reviews around best practice. These best practices can, in turn, help shape the plans of care for future patients. SHP will continue to build out these reports to help home health agencies meet their benchmarking and analytic needs.
Learn more about SHP Solutions for Home Health.