Data analytics & benchmarking
Quantitative, actionable insights are crucial to manage trends affecting providers in the numbers-driven healthcare industry. With real-time data and actionable reports from SHP you can improve your quality, Star Ratings, and patient experience by tracking daily performance and smartly focusing on areas requiring change. The trends affecting providers today include higher expectations of quality, the movement toward value-based purchasing, and shrinking reimbursements. To be successful and competitive in this environment, home health agencies require actionable insights, real-time analytics, and hard facts on performance across their entire organizations, at each location, and for isadividual clinicians.
SHP helps your agency’s performance improvement by bringing a real-time data solution with the largest-in-the-industry database of national and state benchmarks. SHP can automatically receive your data daily from your software vendor. And then, SHP gets to work:
- We transform your volumes of data into actionable insights with our easy-to-interpret reports.
- We compare your performance metrics to our benchmark database.
- We organize your data over time to see positive and negative trends.
- We analyze your data to reveal trouble spots and help you improve revenue, Star Ratings, staff performance, and patient experience.
We make it easy for you. Our intuitive, color-coded format shows you where to focus your attention by identifying at-risk patients, lost revenue opportunities, wasted expense, a decline in your Home Health Star Rating measures, poor staff performance or underperforming patient experience, and many other process and quality measures.
With SHP for Agencies solution you get access to:
- SHP Dynamic Dashboard
- Full suite of benchmarking reports, including:
- Clinical Quality
- Hospital Utilization
- Financial/Operational
- Staff Performance Scorecard
- Home Health Value-Based Purchasing
- Performance Scorecard by referral source, Dx category, and more
You can track your clinical quality metrics with SHP’s real–time Home Health Compare (HHC) report. It shows you what is happening today, not 9 months ago, and you drill down on any score to pinpoint issues. We indicate by color coding whether your scores are better or worse than the benchmarks. You can drill down to an individual patient or clinician. With our new parameter filters, you can run the HHC report by referral source, last inpatient facility, and payer. Very helpful in identifying performance variances and sharing with your community partners.
Our Home Health Compare Star Ratings Preview report show you what your Star Ratings are now, and what they are projected to be in the future CMS posting, months before they are publicly scrutinized. The report is real-time, and it is presented in an intuitive format. You will see immediately your greatest opportunities for improvement by reviewing how close you may be to CMS cut points.
Track your financial and operational metrics
Financial Executive Advantage (EA) report displays your data on episodes in total (started, recertifications, discharged), by provider and payer group. You can further explore RAC risk metrics – both at the organizational and patient level for subsequent investigation. Better manage your case weight, revenue and patient care by reviewing metrics on therapy utilization, visit utilization, LUPA metrics, average case weight at RAP vs. final – all presented against benchmarks to better understand your performance.
Manage your staff performance effectively
SHP pioneered clinician scorecards to help home health agencies focus on the right education and training for their teams. SHP staff performance reports for clinicians, case managers, specific teams, and physicians include clinical, financial and patient experience metrics – all integrated in scorecards.
You move quickly from overall performance for your selected overview report right down to individual clinicians/case managers to discover high performers and those who may need additional training.
Track your real-time Home Health Value-based Purchasing (HHVBP) performance
View your Real-Time Value-Based Purchasing (VBP) Total Performance Score (TPS) to help you succeed in the changing value-based reimbursement environment. Your agency can review its current performance and its expected achievement and improvement points for each of the Home Health Value-Based Purchasing measures, along with a calculated total performance score. You can also get your percentile rank against the appropriate SHP state benchmark for each HHVBP measure and TPS. You can further drill down to the patient or survey details behind each score.
Start your day with the SHP custom dashboard
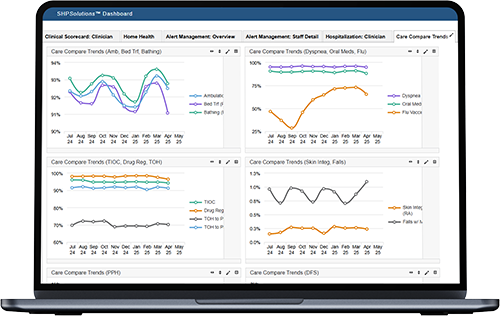
The dashboard gives you a quick view into your organizational performance. We have created more than 25 charts that you can choose from. You choose the metrics and locations you need to see, depending on your responsibilities and position in the organization. Initial setup is very simple.
SHP Dashboard is your portal to the SHP Reports that give insights on your enterprise-wide performance, drilled down to individual location, clinician or patient.
Manage your hospitalizations
Given the importance of this measure, we provide three ways to analyze your hospitalization :
- All hospitalizations
- 30-day rehospitalization rate
- 60-day hospitalization rate
See how you stack up against SHP’s state and national benchmarks. You are empowered by detailed information on individual patients, hospitalization reason, and hospital penalty diagnosis groups so you can focus your improvements.
Utilize predictive analytics to better care for high risk patients
SHP’s predictive alerts such as “risk of hospitalization” and “candidate for hospice referral” help you better monitor high-risk patients. These alerts assist you in keeping patients out of a hospital or ensure that they are being cared for in the appropriate setting.
We give you the enterprise solution
Our customers range from single-site home health agencies to national networks with hundreds of locations. Even home health organizations with complex hierarchies are able to benchmark performance at every level of the enterprise at the click of a button. Our Executive Advantage reports give you an opportunity to review the combined performance and also compare your agencies to each other across all outcomes and process measures, 30 and 60-day hospitalization, and HHCAHPS scores.
Communicate with your referral sources
Our reports are easy to share with your key referral sources so you stay competitive in your local market. Running the scorecard reports by referral source allows you to share each of your Home Health Compare scores specific to each referring entity.
Track your telehealth patients
SHP provides unique insights on how telehealth monitors affect overall patient care. The tool is important for home health agencies that use telehealth providers to gauge the type of patients who benefit the most from telehealth monitors and exactly how the monitors affect outcomes, rehospitalizations, and your organization’s bottom line.