Home Health Value-Based Purchasing – What scores should I be shooting for?
You likely have heard the Wayne Gretzky quote “I skate to where the puck is going to be, not where it has been”. With the second performance year (CY 2017) of HHVBP over, I wanted to see how the year over year measure outcomes changed across our SHP national database.
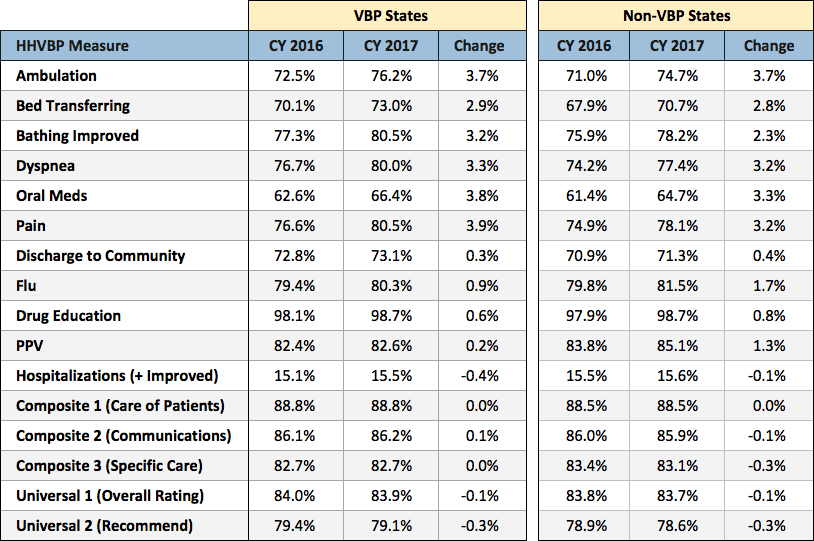
Comparing the same agencies year over year it appears both HHVBP states and Non-VBP states improved about the same on their average outcomes and process measure scores with little change in the HHCAHPS scores (see graph below).

Source: SHP National Database – Agencies with 11 or more applicable VBP measures
Notice that with the exception of Flu, PPV and the HHCAHPS Composite 3 scores, VBP agencies had better outcomes than their non-VBP state agency peers. I expect CMS has noticed that too. Comparing the change from CY 2015 to CY 2016, the pace of change into CY 2017 has also declined. Excluding HHCAHPS scores, agencies from VBP states improved in every measure CY 2015 through CY 2017 except Hospitalizations, but at a slower rate in CY 2017 (50% less on average) compared to the rate a year earlier.
In deciding what scores you want to target, it is best to know what percentile rank you want to realistically achieve. HHVBP’s Total Performance Score (TPS) uses percentile ranking to compare your scores to the competitors within your VBP state. The higher your TPS, the greater the likelihood to earn a bonus.
In order to receive achievement points in any given measure, scores need to be higher than the CY 2015 median values. The higher the percentile rank, the greater the number of overall points you will earn. For example, the median SHP score for Ambulation in CY 2017 was 75.2%, slightly higher than the overall average of 74.9%. To be at the 75th percentile ranking, you would have needed a score of 79.8%.
Knowing that state and national scores will continue to improve, you will need to add a factor to your overall target. Ambulation improved 7.1% in CY 2016 and 3.7% in CY 2017 and likely will improve again as much as 2 to 3 percentage points in CY 2018. Adding a reasonable factor is critical for measure goal setting and tracking your progress.
Using real-time data and being able to track your performance against your peers is also a must in value-based reporting. Only then can you best determine what outcome scores to shoot for.

