Medicare Rate Cuts to Reduce Home Health Reimbursement 4.2% in CY 2023
The proposed CMS Home Health Prospective Payment System Rate Update was posted to the Federal Register on June 23rd, a bit earlier in the annual rule-making cycle than the past several years. As part of the overall reimbursement cuts, CMS is proposing a 7.69% rate cut to reflect their calculations on behavioral adjustments. These adjustments are intended to account for the actual vs assumed behavior changes on aggregate expenditures due to the switch from HH PPS to PDGM. Keep in mind this is a prospective rate cut starting in CY 2023, and does not address the overpayments from CY 2020 and CY 2021. CMS has requested comments on how to recoup these overpayments.
It seems somewhat unfair given at the same time CMS is expanding the HHVBP program nationally where CMS expects to save the Medicare program $3.38 billion over the next five years. The CMS CY 2023 National Standardized rate will be reduced by 6.25% to $1,904.76, including the behavioral adjustment, case-mix weight and wage index neutrality factors, and a cost-of-living adjustment (COLA) of 2.9% (3.3% less a productivity factor of -0.4%). This COLA appears very low given the higher price and wage inflation we have seen over the last couple of years. Using AAA’s calculator, regular gas prices are up 55.0% year over year. Salaries have also been steadily increasing to counter the staffing shortages due to COVID and the “great resignation”.
It will be important for agencies facing these rate cuts to find new operating efficiencies in their businesses, especially when it comes to labor and staffing, the majority of an agency’s cost. Adequate staffing is at a premium where demand is high but capacity remains low. Now is the time to make sure to get your patient visit utilization right. Finding the “best practices” to achieve great outcomes with the right number of visits has continued to be the holy grail.
To help our customers with the utilization management process, we created a Care Optimization Suite—and accompanying introductory webinar—that provides some important insights in setting a patients’ plan of care for the first 60 days after admission. Knowing that every patient is different, we expose the key OASIS items that drive visit utilization and factor coloring that correlates with higher and lower visits utilization. We also provide benchmarks that reports on “successful” patients in similar or “like” groupings.
Using the millions of patient records in our national database, we define “success“ as: patients that were discharged to community, were not hospitalized, didn’t have a LUPA or PEP, and that also achieved high improvement outcome scores. “Like” patients include those with the same primary diagnosis category and the same risk of hospitalization group (low, medium and high). The result is a visit benchmark by discipline that helps formulate an optimized plan of care.
Below is an example of the benchmarks for a successful Medicare patient that is at moderate risk of hospitalization, has a primary diagnosis category of “Infection-UTI”, and is expected to be on service for either one or at least two 30-day periods.
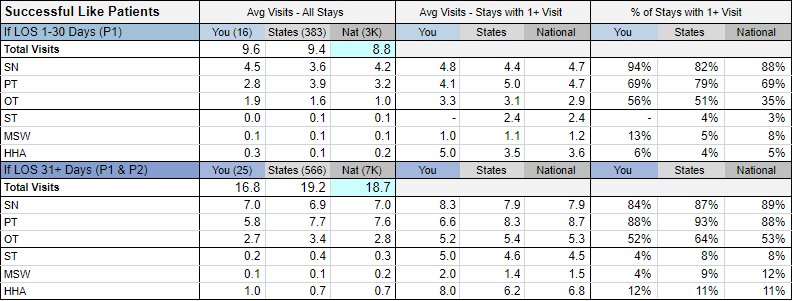
We compare your successful like patients against our state and national benchmarks to detect where there may be differences and opportunities for adjustments to the plan of care. For example, when looking at patients on service for 30-days only, this agency provided nearly one visit more than the national average. However, for patients on service for 2 periods of more, the agency provided nearly two visits less than the national average. We also share the average visits and % of stays where the discipline is ordered and provided during the stay.
The CMS proposed rate cut may be revised based on industry comments and an updated cost-of-living factor before the final rule is promulgated. Given the likelihood of a significant behavioral adjustment, and future retroactive cuts from CY 2020 and CY 2021, now is the time to revisit the tools and strategies your agency utilizes to become more efficient. Pursuing quality outcomes to achieve higher star ratings and HHVBP scores will be essential, but hopefully at the “best practice” number of visits.
If you are not a customer today, please reach out to us to schedule a free demo of our SHP for Agencies solution.