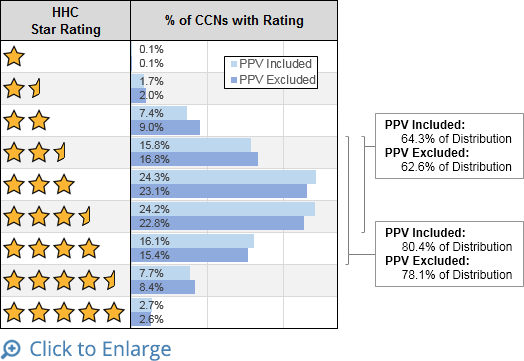
CMS made the Star Rating Preview Reports available within the last two weeks, and as expected, the rating system steers the majority of providers (62.3%) between 2 ½ and 3 ½ stars. CMS claims they will be educating patients on what it means to be an “average” provider. Since the process measure for Pneumococcal vaccine was recently eliminated from the scores, CMS has updated the expected scoring distribution using FY13 data (see graphic). The changes have slightly increased the number of agencies on each end of the bell curve. Where does your agency fall in the ratings?
Providers have a short window to review the Star Rating Preview reports and submit a request by April 17th with any discrepancies found in their data. This will be the last chance to make any changes before your star ratings are reported on Home Health Compare in July ‘15. SHP has prepared a review guide with links to the CMS resources for your reference. Although CMS is not expecting data discrepancies, it’s possible that CMS is working with incomplete data and this is where the greatest potential lies for incorrect publicly reported scores.
Once you have confirmed your data is valid, what do you do next? Are your scores being adjusted toward the middle of the curve? How close are your scores to the cut points? Agencies will need to determine where they have the greatest opportunity to increase their overall ratings. It begins by understanding each measure and what steps you can take working with your clinicians to improve your outcomes.


