Value Based Purchasing – What is my target?
One of the sections in the Home Health Proposed Rule outlines and defines how Home Health Value Based Purchasing (HHVBP) total performance scores will be calculated. For each of the 25 OASIS and HHCAHPS measures, CMS will calculate both a threshold and a benchmark for each from agency’s base year scores.
- Threshold is the median (the 50th percentile) for that particular measure.
- Benchmark is the mean of the top decile of all the scores from the base year.
Points will be awarded in an agency’s performance year for both achievement and improvement. The agency will receive the points from only the higher of the two.
- Achievement points will be based on reaching or exceeding the threshold. The higher your score, the more points you will receive (up to 10) when you reach the benchmark.
- Improvement points will be based on the amount of improvement from the base year. The more you improve, the more points you will receive (up to 10) when you reach the benchmark.
Both sets of calculations are derived using base year scores. Thus the quandary—What is my target?
 Click to Enlarge
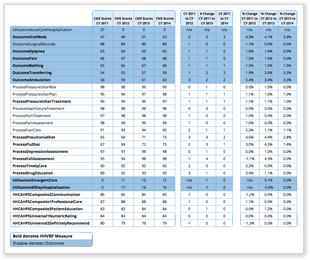
Table 1: National HHC Scores Trended Over Time
Since the base year (Calendar Year 2015) has not yet closed, how do you know what your overall targets should be? Sure, you can look at CMS historical scores reported on Home Health Compare (HHC), but you need to account for the fact that many scores have improved year over year. I was interested in seeing how HHC scores for the 20 measures used for HHVBP have changed over time. Table 1 lists the national score changes on both an absolute and percentage basis.
Interestingly, HHCAHPS measure scores have not changed all that much. Two went down and two went up over three years. For OASIS HHVBP outcomes excluding the utilization outcomes, four of the six measures improved each year, and two showed no changes in the last year. Of the seven HHVBP process measures, three improved every year, and four had no change in the last year.
| Change Over Last 3 Years | Change Over Last Year | |||||
|---|---|---|---|---|---|---|
| # Improved | # No Change | # Declined | # Improved | # No Change | # Declined | |
| HHCAHPS Quality Measures | 2 | 1 | 2 | 0 | 5 | 0 |
| HHVBP Outcome Measures | 6 | 0 | 0 | 4 | 2 | 0 |
| HHVBP Process Measures | 7 | 0 | 0 | 3 | 4 | 0 |
For goal setting, not only do you need to plan on improving your scores on low performing measures, but you need to also look at how the HHVBP scores changed across the years. Although many of the process measures may have topped out, there is still room to improve, especially now that HHC scores are reported to the tenth decimal starting in July 2015. You will need to plan your target based on where you want to be relative to your peers.
For HHVBP, your peers will be based in your state. Keep in mind though, for the new Quality of Patient Care Star ratings, your peers are the national CMS benchmark. Benchmarking your scores on a real-time basis, both on a state and national level, will be an important contributor to your success.

