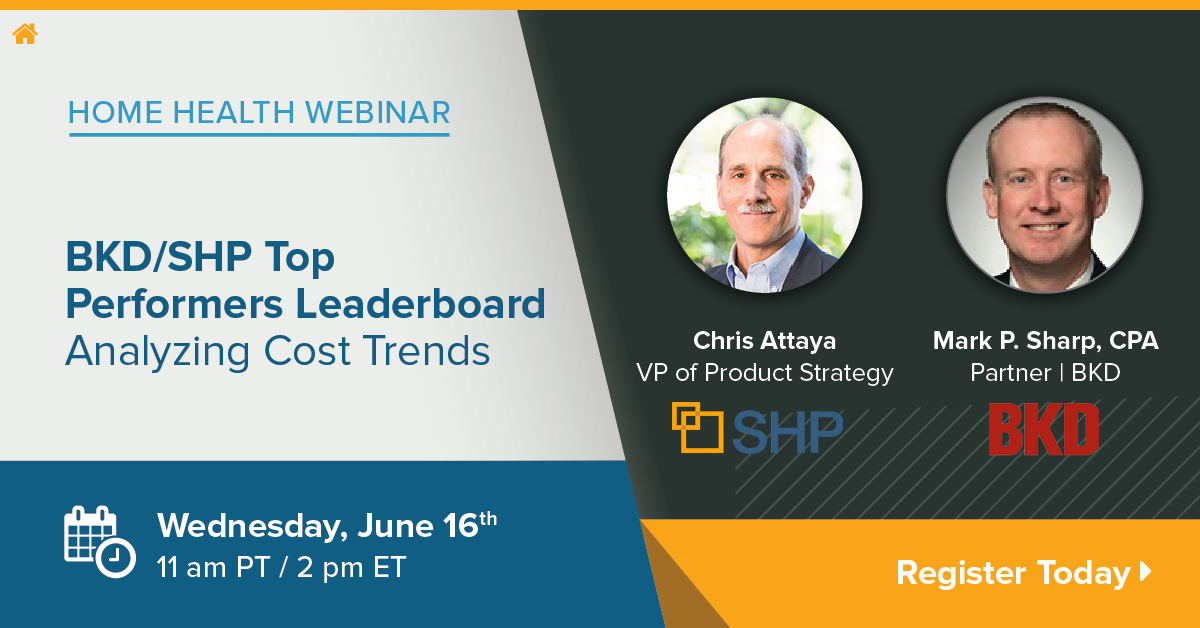
As home health agencies have transitioned into PDGM in the last year, there has been much focus on analysis of revenues under the new payment model. Agencies shouldn’t lose sight of the importance of analyzing and understanding its costs as the PDGM model had an inherent cut in it as well as increased Medicare managed care penetration in most locations. When it comes to profit margins, costs per visit, costs as a percent of revenue, paid hours per visit and other key cost and productivity indicators, how are the top agencies' performance and benchmarks changing?
In this SHP webinar, Mark Sharp from BKD and Chris Attaya from SHP, present findings of the annual SHP and BKD joint benchmarking project as they compare recently released 2019 cost report indicators to prior years. Please join us in this presentation as we combine financial, clinical, operational, and HHCAHPS data to identify the key cost characteristics of top performing agencies and how they are trending.
This webinar is open to everyone and free of charge.

